Drawing a Rose Curve with TikZ in LaTeX

Introduction
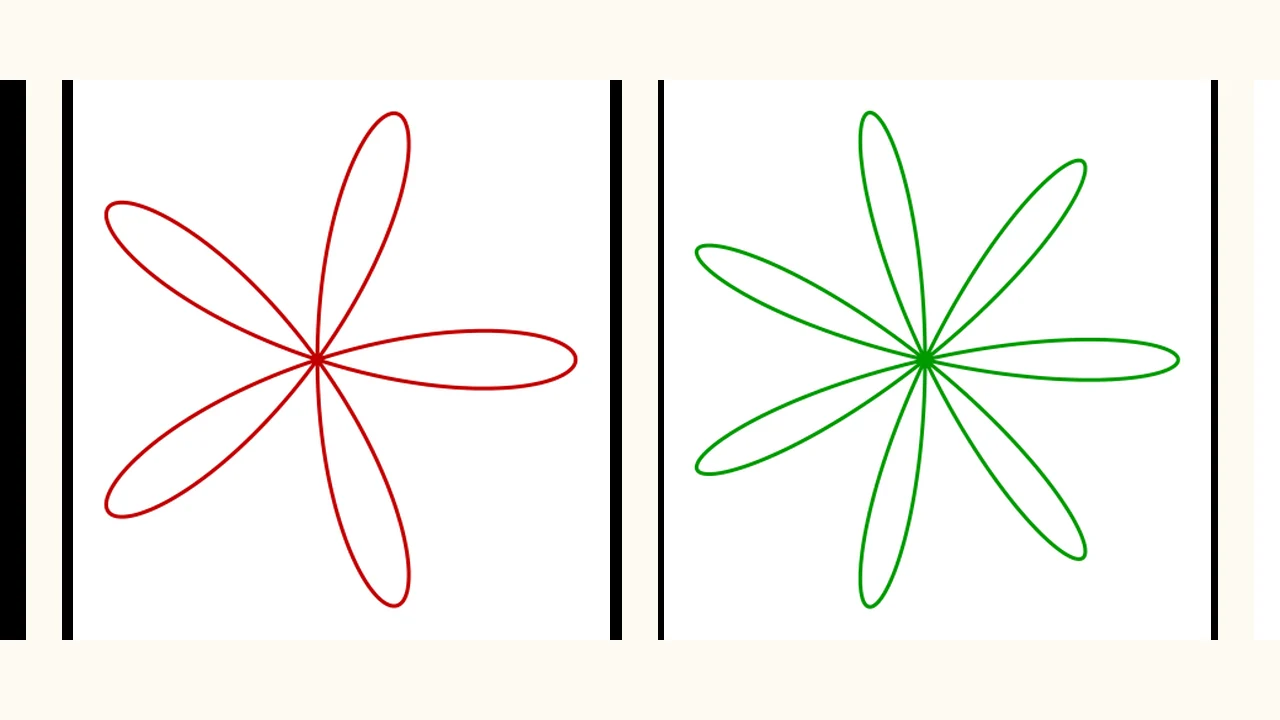
The rose curve is one of the most visually beautiful mathematical curves. It was first studied in depth by the Italian mathematician Guido Grandi in 1725. Its flower-petal-like shape makes it a favorite in mathematical art and decorative design.
This article discusses the mathematical analysis of the rose curve and the LaTeX TikZ coding technique to draw it, complete with source code, compiled output, and experiments with different petal counts.
Mathematical Analysis: The Polar Equation of the Rose
The rose curve is defined in polar coordinates by the general equation:
where:
- = amplitude (maximum petal length from the center),
- = constant that determines the number of petals,
- = polar angle ().
The number of petals is determined by the value of :
- If is odd → the curve has petals (e.g., → 5 petals),
- If is even → the curve has petals (e.g., → 16 petals).
In this article we use with cm, and vary to obtain different rose shapes.
LaTeX Source Code
Here is the complete TikZ code to draw a rose with :
\documentclass[tikz,border=10pt]{standalone}
\usepackage{tikz}
\begin{document}
\begin{tikzpicture}
  \draw[very thick, red!75!black, domain=0:360, samples=600, variable=\t]
    plot ({2.9*cos(5*\t)*cos(\t)}, {2.9*cos(5*\t)*sin(\t)});
\end{tikzpicture}
\end{document}
Compiled Output
The code above was compiled with the Tectonic engine (XeLaTeX-based), producing the following image:
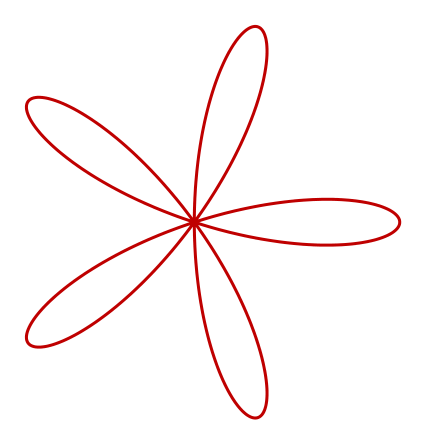
A rose with 5 petals because (an odd number). The petals are symmetrically arranged around the center, resembling a perfectly bloomed flower.
Explaining the Code Structure & Logic
Let us break down the code line by line:
1. The Standalone Document Class
\documentclass[tikz,border=10pt]{standalone}The standalone class crops the output tightly to the drawing (no full page), with a 10pt margin. The tikz option loads the core TikZ library automatically.
2. The \draw Command with plot
\draw[very thick, red!75!black, domain=0:360, samples=600, variable=\t]
  plot ({2.9*cos(5*\t)*cos(\t)}, {2.9*cos(5*\t)*sin(\t)});
The key parts of this command:
| Option | Purpose |
|---|---|
domain=0:360 | The angle range from 0° to 360° (one full revolution) |
samples=600 | Number of points computed along the curve — the more, the smoother |
variable=\t | Defines the angle variable as \t |
plot ({...}, {...}) | Computes Cartesian coordinates from polar coordinates |
3. Converting Polar to Cartesian
A polar point is converted to Cartesian coordinates by:
Since , we have:
This is exactly what is written in the plot expression above. Note that TikZ trigonometric functions work in degrees, so domain=0:360 directly corresponds to one full revolution.
Experiments with TikZ Variations
The beauty of the rose curve is that we can change its shape simply by changing the value of . Here are some variations:
Variation 1: k = 3 (Three Petals)
\draw[very thick, blue!75!black, domain=0:360, samples=600, variable=\t]
  plot ({2.9*cos(3*\t)*cos(\t)}, {2.9*cos(3*\t)*sin(\t)});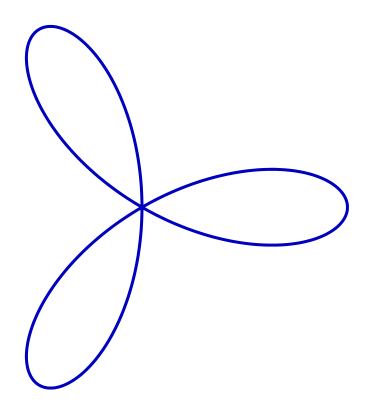
(odd) produces 3 wider petals.
Variation 2: k = 7 (Seven Petals)
\draw[very thick, green!60!black, domain=0:360, samples=600, variable=\t]
  plot ({2.9*cos(7*\t)*cos(\t)}, {2.9*cos(7*\t)*sin(\t)});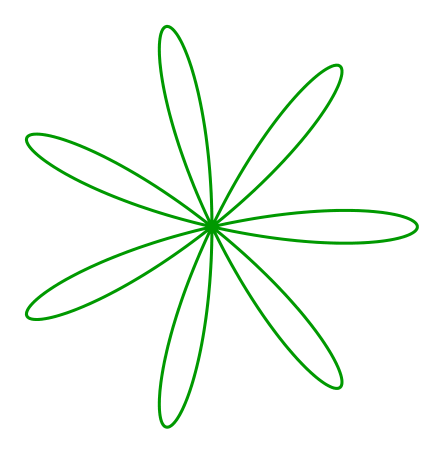
produces 7 slimmer, tighter petals.
Variation 3: k = 8 (Sixteen Petals)
\draw[very thick, orange!80!black, domain=0:360, samples=800, variable=\t]
  plot ({2.9*cos(8*\t)*cos(\t)}, {2.9*cos(8*\t)*sin(\t)});
Since is even, the curve has petals. The petals are denser, so the number of samples is increased to 800 to keep the curve smooth.
Conclusion
Drawing a rose curve with TikZ turns out to be very simple — just a single \draw command with plot and a bit of trigonometry. The key is understanding the conversion from polar to Cartesian coordinates:
By varying the value of and the color, we can produce a wide range of attractive flower shapes, from 3 petals to dozens of petals. This curve is well suited for practicing trigonometric function graphs, polar coordinates, or simply creating mathematical art in LaTeX.
References
- Wikipedia, Rose (mathematics) — https://en.wikipedia.org/wiki/Rose_(mathematics)
- TikZ & PGF Manual — https://tikz.dev
- Related article on this blog: Drawing a Sunflower Pattern (Phyllotaxis) with TikZ