Data Collection and Presentation

Introduction
Data is essential in everyday life. Clear data helps us make decisions, compare information, and explain a situation more accurately. To make data easier to read, it is usually presented in the form of tables or diagrams.
Collecting Data
In general, data can be divided into two main types:
Quantitative data
Quantitative data is numerical data, for example:
- average monthly income
- population size
- number of children in a family
Quantitative data can be divided into:
- discrete data, obtained by counting
- continuous data, obtained by measurement
Examples of discrete data: number of students in a school.
Examples of continuous data: height and weight.
Qualitative data
Qualitative data is non-numerical data, for example:
- economic level
- occupation
- gender
An important note:
Presenting Data
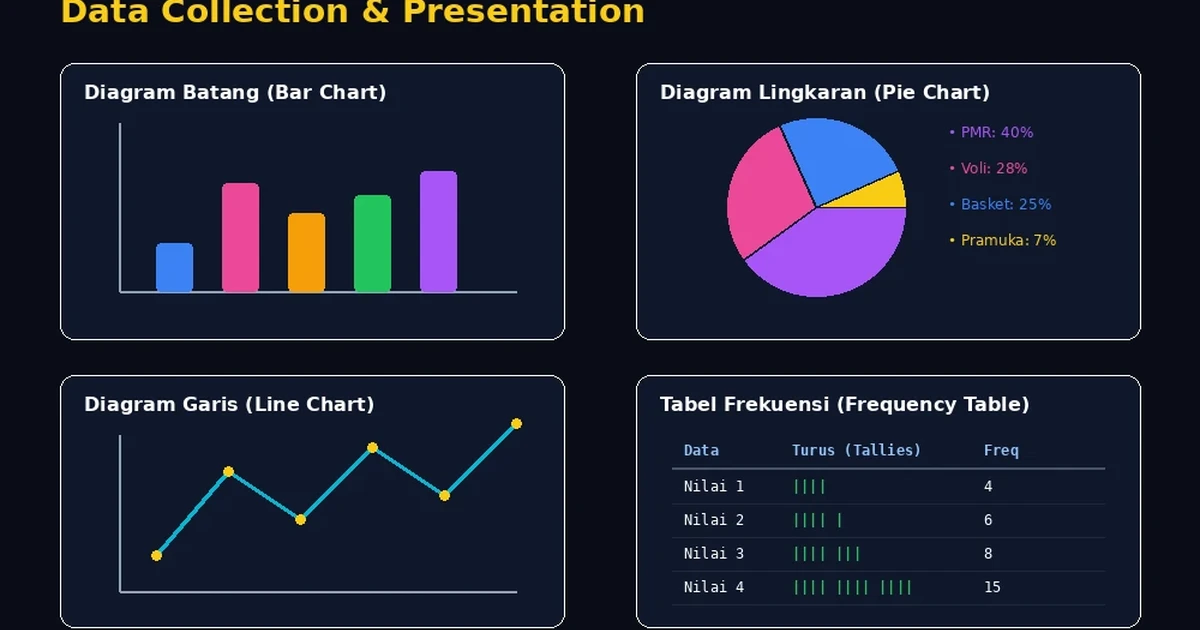
Collecting data is not enough by itself. Data must also be presented in a form that is easy to read and understand. Common forms include:
- tables
- bar charts
- line charts
- pie charts
- pictograms
Presenting Data Using Tables
Single Frequency Table
Consider the following data showing the number of children in 40 families:
1, 4, 3, 4, 5, 4, 3, 6, 1, 2, 2, 3, 2, 4, 1, 6, 5, 3, 4, 3, 4, 4, 5, 4, 4, 4, 6, 5, 4, 4, 2, 4, 3, 3, 2, 4, 2, 3, 4, 1
A single frequency table for this data is:
| Number of children | Tally | Frequency |
|---|---|---|
| 1 | ` | |
| 2 | ` | |
| 3 | ` | |
| 4 | ` | |
| 5 | ` | |
| 6 | ` | |
| Total | 40 |
In a single frequency table, each row represents only one data value.
Grouped Frequency Table
Now consider the following mathematics test scores:
44, 54, 85, 92, 73, 99, 91, 96, 74, 75, 70, 57, 83, 49, 57, 52, 64, 73, 82, 90, 70, 89, 91, 67, 52, 64, 73, 82, 59, 65, 79, 82, 89, 53, 52, 50
The highest score is 99 and the lowest is 44, so the range is:
Because the range is fairly large, the data is more practical in a grouped frequency table:
| Score interval | Tally | Frequency |
|---|---|---|
| 44 - 51 | ` | |
| 52 - 59 | ` | |
| 60 - 67 | ` | |
| 68 - 75 | ` | |
| 76 - 83 | ` | |
| 84 - 91 | ` | |
| 92 - 99 | ` | |
| Total | 36 |
Important terms:
- class interval: one score group
- number of class intervals: total number of groups
- interval length: width of each interval
For the table above:
- number of class intervals =
7 - interval length =
8
Notes:
The smallest and largest values must still be included in the intervals.
The number of classes can be estimated using Sturges’ rule:
where is the number of data values.
Presenting Data Using Diagrams
Data can also be displayed with diagrams.
Bar Chart
A bar chart uses:
- a horizontal axis for categories
- a vertical axis for values or frequencies
Example of average mathematics scores:
| Student | Average score |
|---|---|
| Abdi | 65 |
| Andi | 85 |
| Bayu | 70 |
| Cindi | 80 |
| Clara | 60 |
| Diva | 90 |
Steps to make a bar chart:
- write the title
- place the categories on the horizontal axis
- place the values or frequencies on the vertical axis
- choose a suitable scale
- draw one bar for each category
.png)
In a bar chart, all bars have the same width, while the height represents the value or frequency.
Pie Chart
A pie chart presents data as sectors of a circle. The central angle of each sector represents the proportion of one category compared with the entire data set.
Example:
In one class of 60 students, each student chooses one extracurricular activity:
- basketball:
15students - volleyball:
17students - PMR:
24students - scouts:
4students
The calculations are:
| Activity | Frequency | Percentage | Central angle |
|---|---|---|---|
| Basketball | 15 | 25% | 90° |
| Volleyball | 17 | 28.3% | 102° |
| PMR | 24 | 40% | 144° |
| Scouts | 4 | 6.7% | 24° |
| Total | 60 | 360° |
For scouts:

Line Chart
A line chart is commonly used to show change over time, such as:
- daily visitors
- hourly temperature
- monthly sales
Data points are plotted on a coordinate plane and then connected with line segments.
Pictogram
A pictogram presents data using pictures or symbols. Each picture stands for a certain number of objects.
Examples:
- 1 book icon may represent 5 books
- 1 student icon may represent 10 students
Pictograms are useful for simple data that should be understood quickly.
Closing
Collecting and presenting data is a basic part of statistics. When data is presented in the right format, it becomes much easier to read, compare, and analyze.