Drawing Flat Shapes
Drawing Figures with TikZ in LaTeX
Gambar can be used as a medium to convey messages from the maker to other people. Many applications can be used to draw an object. LaTeX is no exception, there are several packages available that are used to draw in the documents you create, such as the PGF, TikZ, and PSTricks packages. Of course, the drawing process begins by writing the package in the preamble, and certain commands in the preamble or in the body of the document, then compiling it so that the results of the drawing commands are visible.
 So how do you draw in LaTeX?
Getting to know the TikZ Package
In this article, I will provide a simple guide for drawing several flat shapes using the TikZ package. You must first include the package \usepackage{TikZ} in the preamble to the document. By using the TikZ package we can place images in inline mode or in command scope (environment). Look at the following image to see the difference.
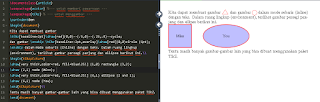 The images of circles, triangles, rectangles and ellipses are obtained from commands such as the following.
\begin{tikzpicture}
%--- Menggambar garis-garis bantu (grid) ---
\draw[step=1cm,gray,very thin] (-4,-4) grid (4,4);
%--- Menggambar garis sumbu X ---
\draw[thick,<->] (-5,0) -- (5,0)node[anchor=north west] {$X$};
%--- Menggambar garis sumbu Y ---
\draw[thick,<->] (0,-5) -- (0,5)node[anchor=south east] {$Y$};
%--- Menggambar nilai sumbu X ---
\foreach \x in {-4,-3,-2,-1,1,2,3,4}
  \draw (\x cm,1pt) -- (\x cm,-1pt)node[anchor=north] {$\x$};
   %--- Menggambar nilai sumbu Y ---
 \foreach \y in {-5,-4,-3,-2,-1,1,2,3,4}
   \draw (1pt,\y cm) -- (-1pt,\y cm) node[anchor=east] {$\y$};
\draw(0,0) circle (2); % --- lingkaran berada pada koordinat (0,0) dan berjari-jari 2 ---
%--- Menempatkan titik O pada koordinat (0,0) ---
\coordinate [label=below:$O$](O) at (0:0);
%--- Membuat noktah di pusat lingkaran (0,) ---
\draw [fill=gray] (O) circle (2pt);
\end{tikzpicture}
Now we will detail how to draw these shapes.
1. Circle
Once the TikZ package is listed in the preamble, continue by creating the \begin{tikzpicture} … \end{tikzpicture} command scope within the document body. It’s a good idea to first create auxiliary lines (grid) and Cartesian coordinates to help determine the coordinates of the image to be created. The command to draw a circle is as seen in the following code.
\begin{tikzpicture}
%--- Menggambar garis-garis bantu (grid) ---
\draw[step=1cm,gray,very thin] (-4,-4) grid (4,4);
%--- Menggambar garis sumbu X ---
\draw[thick,<->] (-5,0) -- (5,0)node[anchor=north west] {$X$};
%--- Menggambar garis sumbu Y ---
\draw[thick,<->] (0,-5) -- (0,5)node[anchor=south east] {$Y$};
%--- Menggambar nilai sumbu X ---
\foreach \x in {-4,-3,-2,-1,1,2,3,4}
  \draw (\x cm,1pt) -- (\x cm,-1pt)node[anchor=north] {$\x$};
   %--- Menggambar nilai sumbu Y ---
 \foreach \y in {-5,-4,-3,-2,-1,1,2,3,4}
   \draw (1pt,\y cm) -- (-1pt,\y cm) node[anchor=east] {$\y$};
\draw(0,0) circle (2); % --- lingkaran berada pada koordinat (0,0) dan berjari-jari 2 ---
%--- Menempatkan titik O pada koordinat (0,0) ---
\coordinate [label=below:$O$](O) at (0:0);
%--- Membuat noktah di pusat lingkaran (0,) ---
\draw [fill=gray] (O) circle (2pt);
\end{tikzpicture}
The resulting image looks like the following.
 To color the circle and thicken the circumference of the circle, we add the [ultra thick, color] option after the \draw command, so that the command to draw the circle becomes \drawultra thick,redcircle (2); . Look at the following image.
 Then, if you want to give double coloring to the circle, give a command such as: \shadedraw[ultra thick,draw=blue,inner color=blue,outer color=red] (0,0) circle (2);

2. Triangle
Drawing a triangle means we connect three lines. For example, in the triangle , this means we connect a line from point A to point B then to point C then back to point A. If the triangle is a right triangle, then we put a right angle at one of the vertices. Then also mark the angles for the other two corner points. For example, consider the following code.
\begin{tikzpicture}
%--- Menggambar segitiga ABC berwarna merah---
  \draw [red](0,0)--(2,0)--(0,2)--cycle;
  %--- Koordinat titik A terletak pada (0,0) ---
  \coordinate [label=below:$A$] (A) at (0,0);
   %--- Koordinat titik B terletak pada (2,0) ---
  \coordinate [label=below:$B$] (B) at (2,0);
   %--- Koordinat titik c terletak pada (0,2) ---
  \coordinate [label=above:$C$] (C) at (0,2);
  %--- Menggambar tanda siku di titik A ---
  \draw [blue](A) +(3mm,0mm) |- +(0mm,3mm);
  %--- Menggambar sudut di titik B ---
  \pic[draw=blue,angle radius=.6cm,pic text=\scriptsize $\beta$, angle eccentricity=.65]{angle={C--B--A}};
  %--- Menggambar sudut di titik C ---
  \pic[draw=blue,angle radius=.6cm,pic text=\scriptsize $\gamma$, angle eccentricity=.65]{angle={A--C--B}};
\end{tikzpicture}
The resulting document is as shown in the following image.
 If you want to color the triangle, then add the [fill=color] command to the triangle drawing command.
3. Rectangle
Like drawing a triangle, drawing a rectangle means we connect four lines where there are two lines that are the same and parallel. Suppose we draw a rectangle , meaning we connect the line from point A to point B then to point C then to point D and back again to point A. For example, consider the following code.
\begin{tikzpicture}
%--- Menggambar persegi panjang ABCD berwarna biru---
 \draw [blue] (0,0) -- (4,0) -- (4,3) -- (0,3) -- cycle;
 %--- Koordinat titik A terletak pada (0,0) ---
  \coordinate [label=below:$A$] (A) at (0,0);
   %--- Koordinat titik B terletak pada (4,0) ---
  \coordinate [label=below:$B$] (B) at (4,0);
   %--- Koordinat titik C terletak pada (4,3) ---
  \coordinate [label=above:$C$] (C) at (4,3);
 %--- Koordinat titik D terletak pada (0,3) ---
  \coordinate [label=above:$D$] (D) at (0,3);
  %--- Menggambar diagonal AC ---
  \draw [red] (0,0) -- (4,3);
   %--- Menggambar diagonal BD ---
  \draw [red] (4,0) -- (0,3);
   %--- Menggambar tanda siku di titik A ---
  \draw [blue](A) +(3mm,0mm) |- +(0mm,2.4mm);
   %--- Menggambar tanda siku di titik B ---
  \draw [blue](B) +(-3mm,0mm) |- +(0mm,2.4mm);
   %--- Menggambar tanda siku di titik C ---
  \draw [blue](C) +(-3mm,0mm) |- +(0mm,-2.4mm);
   %--- Menggambar tanda siku di titik D ---
  \draw [blue](D) +(3mm,0mm) |- +(0mm,-2.4mm);
\end{tikzpicture}
The resulting document looks like the following image.
 If you want to color the rectangle, then add the [fill=color] command to the rectangle drawing command.
Apart from this method, there is a simple way to draw a rectangle. You simply connect the coordinates of the lower left corner and the coordinates of the upper right corner by a rectangle. So for the rectangle in the image above, in the third line you can write the command:
\(\fbox{\draw (0,0) rectangle (4,3);}\)
If you want to color the rectangle, then add the [fill=color] command to the rectangle drawing command.
Apart from this method, there is a simple way to draw a rectangle. You simply connect the coordinates of the lower left corner and the coordinates of the upper right corner by a rectangle. So for the rectangle in the image above, in the third line you can write the command:
\(\fbox{\draw (0,0) rectangle (4,3);}\)
4. Ellipse
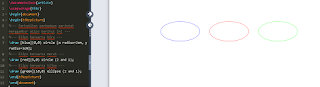
An ellipse can be drawn using the circle or ellipse commands. To make it clearer, look at the following code.
\begin{tikzpicture}
%--- Perhatikan perbedaan perintah menggambar elips berikut ini ---
%--- Elips berwarna biru ---
\draw [blue](0,0) circle [x radius=2cm, y radius=1cm];
%--- Elips berwarna merah ---
\draw [red](5,0) circle (2 and 1);
%--- Elips berwarna hijau ---
\draw [green](10,0) ellipse (2 and 1);
\end{tikzpicture}
The resulting document is as shown in the following image.
5. Parallelogram
To draw a parallelogram, we connect four lines like drawing a rectangle, then on two sides there are two lines made at an angle. To make it clearer, pay attention to the following code.
\begin{tikzpicture}
  %--- Mengatur kemiringan garis ---
    [xslant=1,xscale=2.5,scale=1.5]
  %--- Menggambar jajar genjang ---
    \draw [blue](0,0) rectangle (1,1)
  %--- Menggambar diagonal AC ---
    coordinate(C) node[above]{C} -- (0,0) coordinate(A) node[below]{A} (1,0)
  %--- Menggambar diagonal BD ---
    coordinate(B) node[below]{B} -- (0,1) coordinate(D) node[above]{D};
  \end{tikzpicture}
The resulting document looks like the following image.
 This is a guide on how to draw circles, triangles, rectangles, ellipses and parallelograms in LaTeX using the TikZ package. If there are errors, please correct them, if you don’t understand, let’s discuss, if you have input, please write them here, if you are happy, I will make another guide. I hope this is helpful.