Love in GeoGebra


Contents
Creating a LOVE Graph in GeoGebra
This tutorial shows how to create a graph that looks like the word LOVE in GeoGebra. Each letter is formed from a different equation, then the final result is refined with color, line thickness, and label settings.
Here is an example of the final result.

Steps to Create the LOVE Graph
Open GeoGebra.
To form the letter L, enter the following equation in the Input field:
y = 1/x
- To form the letter O, enter:
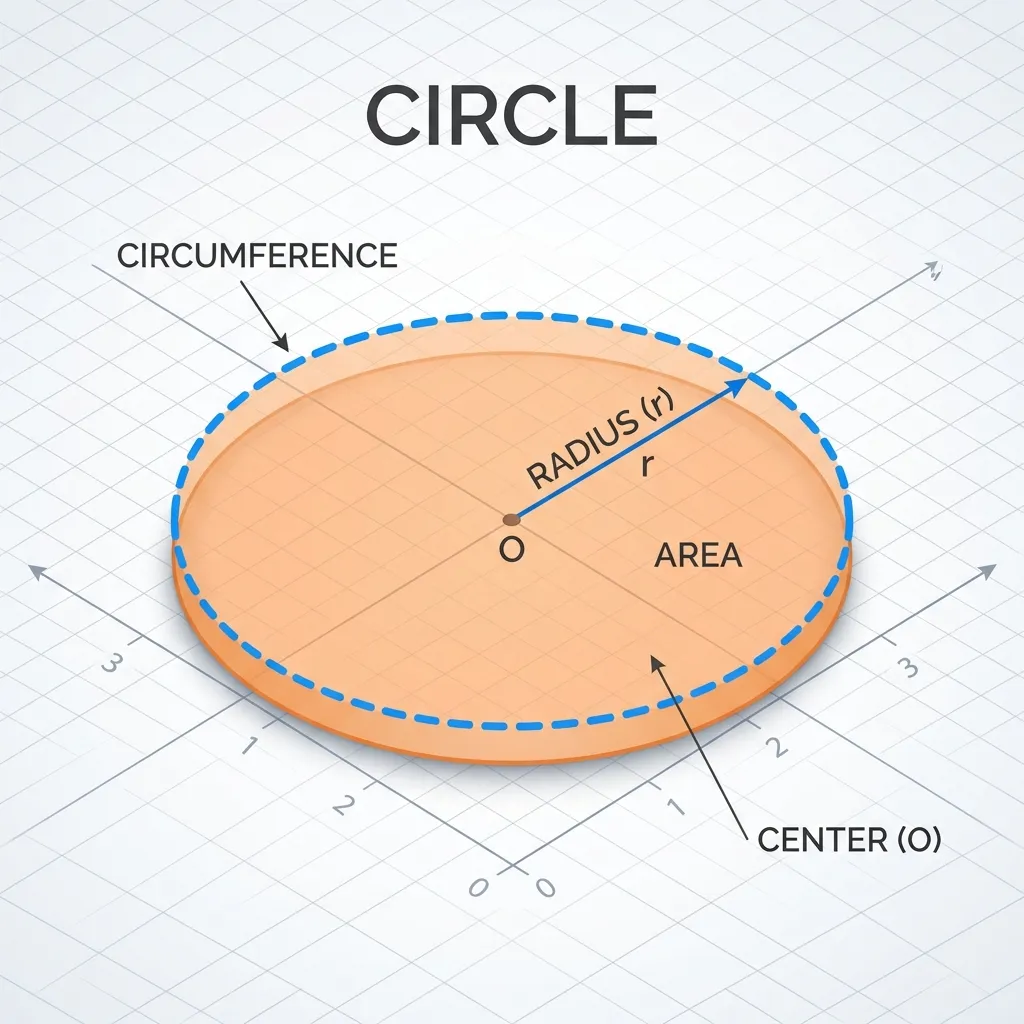
x^2 + y^2 = 2You can change the constant 2 if you want a different circle size.

- To form the letter V, enter:
y = |-2x|
- To form the letter E, enter:
x = -3 sin(y)
- As a final step, change the color of each graph, adjust the line thickness, remove labels if necessary, and refine the layout so each letter is easier to read.
LOVE Graph Result
You can see an interactive example below.
Do you think the graph already looks like the word “LOVE”?
Another LOVE Variation
Here is another variation built with a similar idea.
Closing
That is the basic idea for creating a LOVE graph in GeoGebra. You can extend the same method to build other words or decorative shapes from equations.