Set Intersections

Venn Diagram: Set Intersections
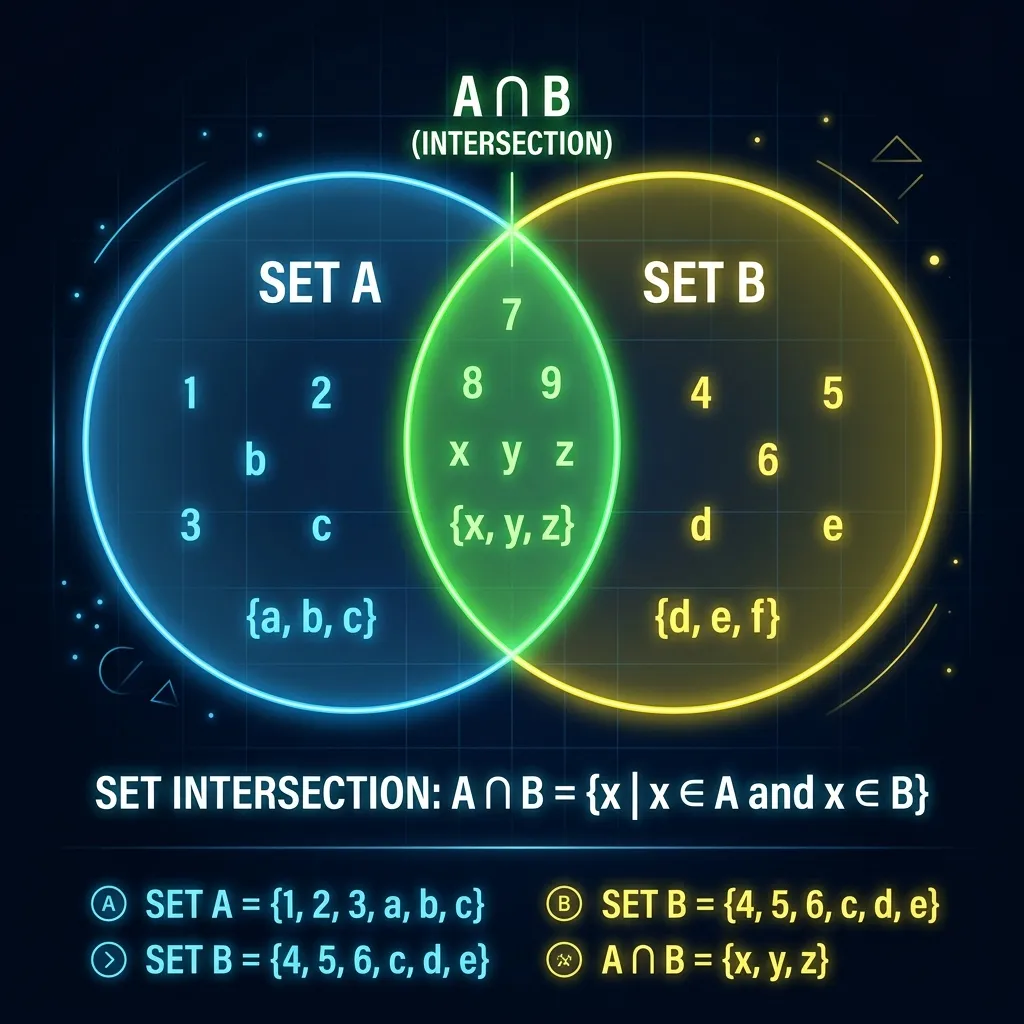
The intersection of sets A and B is the set containing elements that belong to both A and B. It is written as:
In a Venn diagram, the universal set is usually shown as a rectangle, while the other sets are represented by circles or ellipses. The overlapping region represents the intersection.
Consider the following example.

Example Problem
Given:
S = {1,2,3,4,5,6,7,8,9,10,11,12,13}A = {the first six natural numbers}B = {the first six prime numbers}
Determine:
- The members of set
A - The members of set
B - The members of
A \cap B - The Venn diagram for the problem
Drawing the Intersection of Two Sets in LaTeX
To draw a diagram like the example above, you can combine tikz and tcolorbox.
Required packages:
\documentclass{article}
\usepackage{enumerate}
\usepackage{tikz}
\usetikzlibrary{intersections,patterns}
\usepackage[many]{tcolorbox}
\tcbuselibrary{skins}
Example frame setup:
\tcbset{
  frogbox/.style={
    enhanced,
    colback=white!10,
    colframe=green!65!black,
    enlarge top by=5.5mm,
    overlay={
      \foreach \x in {2cm,3.5cm} {
        \begin{scope}[shift={([xshift=\x]frame.north west)}]
          \path[draw=green!65!black,fill=gray!20,line width=1mm]
            (0,0) arc (0:180:5mm);
          \path[fill=black] (-0.2,0) arc (0:180:1mm);
        \end{scope}
      }
    }
  }
}
In the document body, start with:
\begin{tcolorbox}[frogbox,title=\large Venn Diagram]
...
\end{tcolorbox}
The frame looks like this.

Creating the Circles and Guide Lines
Start the drawing area with:
\begin{tikzpicture}
\begin{scope}[fill opacity=.4]
...
\end{scope}
\end{tikzpicture}
To make positioning easier, draw the universal-set rectangle and guide lines:
\draw (-5,5) rectangle (5,-3);
\draw[help lines] (-5,5) grid (5,-3);
Then draw the two intersecting circles:
\path[name path=A,draw,fill=green] (-1.5,1) circle (3) node(NA){};
\path[name path=B,draw,fill=blue]  (1.5,1) circle (3) node(NB){};
The temporary result looks like this.

Highlighting the Intersection Region
To emphasize the overlap, use:
\begin{scope}[fill opacity=1]
\clip (NB) circle (2.99297);
\fill[white] (NA) circle (2.99297);
\end{scope}
Then label the sets:
\node at (-4.8,4.8) {\textbf{S}};
\node at (-3,4) {\textbf{A}};
\node at (3,4) {\textbf{B}};
Inserting the Set Members
Members of set A:
\node at (-3,2) {\textbf{$\cdot1$}};
\node at (-2,1) {\textbf{$\cdot4$}};
\node at (-3,0) {\textbf{$\cdot6$}};
Members of set B:
\node at (3,2) {\textcolor{red}{\textbf{$\cdot7$}}};
\node at (2,1) {\textcolor{red}{\textbf{$\cdot11$}}};
\node at (3,0) {\textcolor{red}{\textbf{$\cdot13$}}};
Members of A \cap B:
\node at (0,2) {\textbf{$\cdot2$}};
\node at (0,1) {\textbf{$\cdot3$}};
\node at (0,0) {\textbf{$\cdot5$}};
Members of the universal set S outside A and B:
\node at (-4,-2)   {\textbf{$\cdot8$}};
\node at (-4,-2.5) {\textbf{$\cdot9$}};
\node at (4,-2)    {\textbf{$\cdot10$}};
\node at (4,-2.5)  {\textbf{$\cdot12$}};
Once everything is placed correctly, remove the guide lines if they are no longer needed. The final result will match the first image.
Drawing the Intersection of Three Sets in LaTeX
To draw the intersection of three sets, add a third circle, say set C:
\path[name path=C,draw,fill=red] (0,-2) circle (3) node(NC){};If you no longer want the A and B overlap to be filled white as before, replace the command with:
\fill[] (NA) circle (0);Then add the members of set C as needed. The result may look like this.

Closing
With TikZ, Venn diagrams for two-set and three-set intersections can be drawn quite flexibly. This approach works well for worksheets, teaching material, and practice problems that need a clean visual representation of set operations.