Sine and Cosine Wave Curves

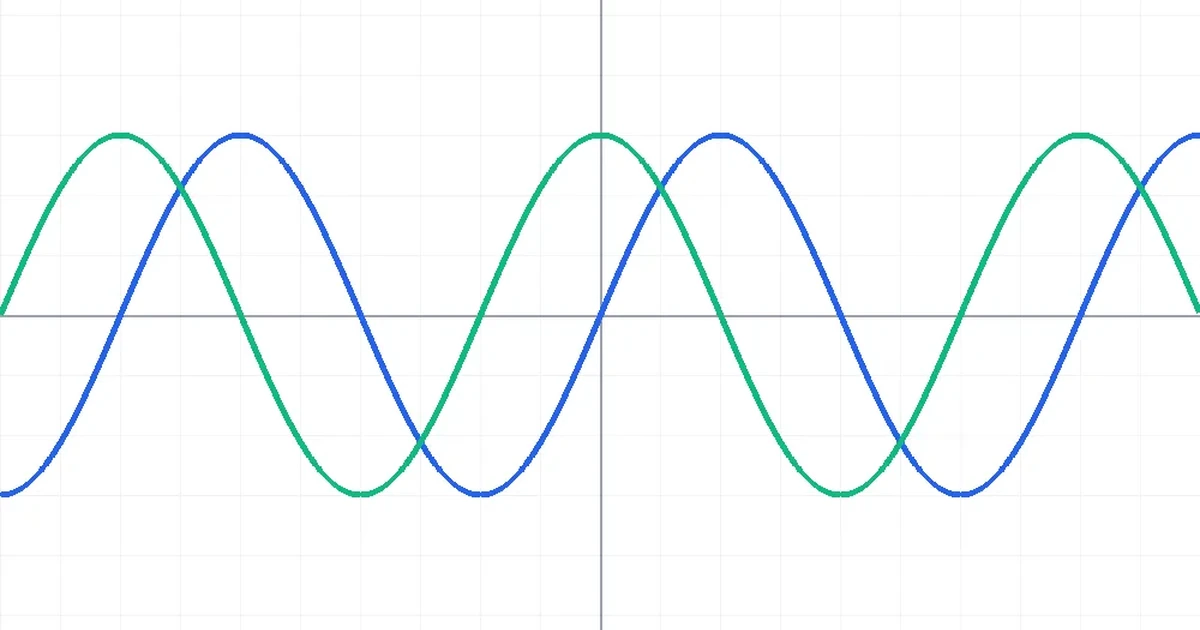
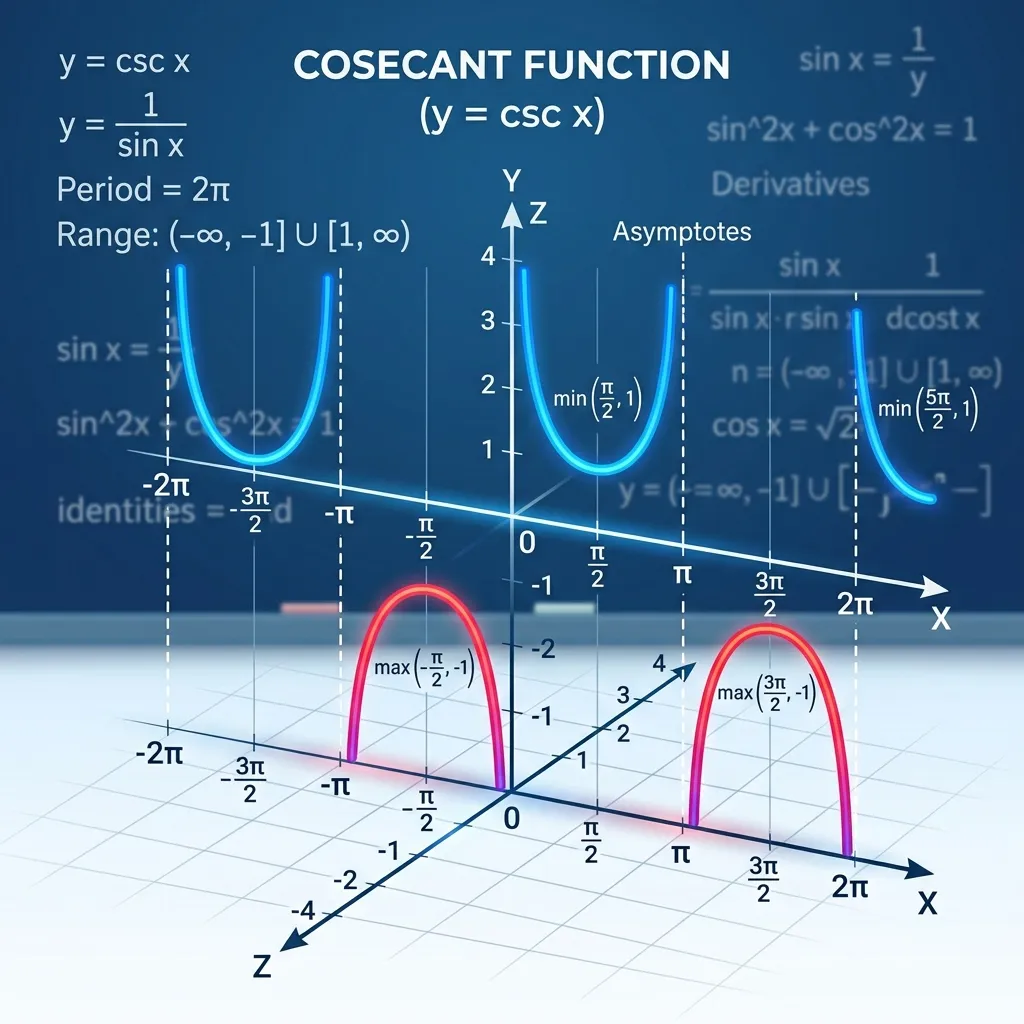
Geogebra is a dynamic program that has facilities for visualizing or demonstrating mathematical concepts as well as a tool for constructing mathematical concepts. In this regard, on this occasion, I will provide guidance on creating and animating trigonometric function curves, namely sine curves and cosine curves. Look at the following image.

Steps to Create and Animate Sine and Cosine Curves in GeoGebra
The way to create and animate trigonometric function curves, namely sine curves and cosine curves, is as follows:
1. Open the GeoGebra Application
Open the GeoGebra application on your computer or device.
2. Set Graphic Display
Right click on Graph View. Look at the following image.

Fill in the graph's abscissa and ordinate format as follows: X axis: min = $-10^0$ and max = $360^0$ Y axis: min = $- 2$ and max = $2$. Look at the following image.

In the xAxis section, fill in according to the following image.

3. Create a Slider/Launch
Make two *slider/glide* that is *slider/glide a* And *slider/glide b* with criteria as in the following image. How to click *Sliders* then click on Graphic Display, a box will appear, fill it in with a name *a* along with other data as shown in the image below.

Click again *Sliders* then click on Graphic Display, a box will appear, fill it in with a name *b* along with other data as below.

So there are two results *slider/glide*.
4. Create Sine and Cosine Curves
On the box *Inputs* write the formula $y = a*sin(b*x^0)$

Next, type $y = a*cos(b*x^0)$ in the box *Inputs*

5. Move the Slider
Move it *slider/glide a* And *slider/glide b*, then the graph curve will move.

6. Enable Animation
Activate the animation by placing the cursor on the second circle *slider/glide*, right click and click *Animation On*, then both curves should move continuously according to changes in the numbers in *slider/glide*. Look at the following image.

The final result
Next, tidy up the display of curves, sliders, graphs and so on. Are the results the same as what shown below? Click **play icon** at the bottom left or move it *slider a* And *slider b *to see the waves ~~Love~~ sine curve and cosine curve.
That's the article for creating and animating sine curves and cosine curves in GeoGebra. If you have suggestions or corrections, please leave them in the comments. I hope this is helpful.