Cosecant Function Graph Animation

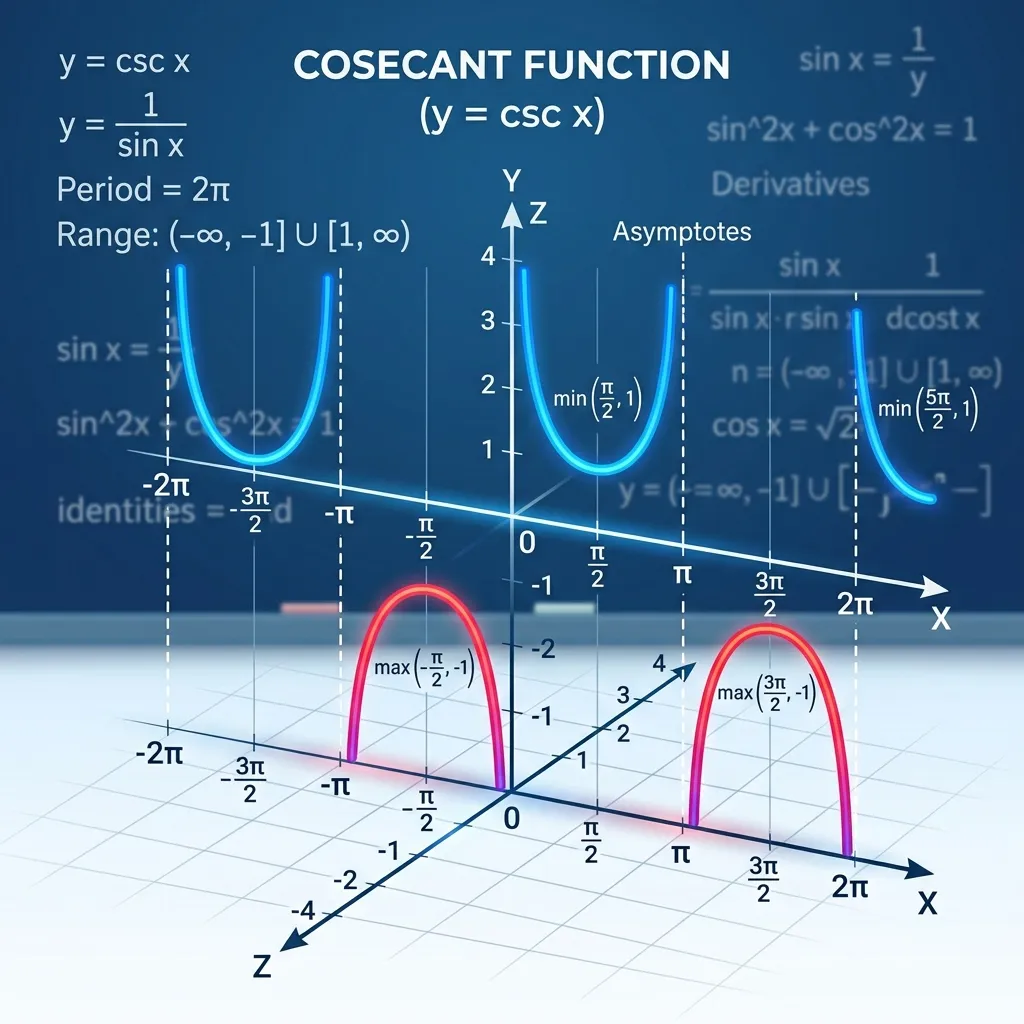
Trigonometry comes from Greek which consists of the words "trigonon" which means triangle, and "metron" which means measure. According to its origin, trigonometry is a branch of science that tries to investigate the motion of celestial bodies such as the sun, moon and stars, including calculating/estimating their positions. Trigonometry is a comparison value defined in Cartesian coordinates or a right triangle. Trigonometry is identical to trigonometric functions which include sine (sin), cosine (cos), tangent (tan), cosecan (cosec), secan (sec), and cotangent (cotan) all of which are ways to determine the side of a triangle or the angle formed from two sides in a triangle.
In this article, I will create a guide on how to create animated graphs of the cosecan (cosec) function using GeoGebra. Look at the following graph of the cosecant function.

Steps to Create a Cosecant Function Graph Animation in GeoGebra
The steps are as follows:
1. Open GeoGebra
Open the GeoGebra application on your computer or device.
2. Open Graphics Settings
Right click on the graphic area, then the Context-menu appears, click *Graphics*.

3. Set Graphic Dimensions
Then fill in the tab *Basic* in part *Dimensions*: xMin = -20, xMax = 400 and yMin = -6, yMax = 6.

4. Set the X Axis
From tab *xAxis* in part *Distance* type $30$. In the Units section select $^0$ (degrees). Click *OK*.

5. Create a Slider
Next we create the slide. Click on tools *Sliders*, click on the graph area, then fill in the slider box. Name: a, Type: Number, Interval Min = $-5$, Max = $5$, Increment = $0.1$.

6. Cosecan Function Input
Then on *Inputs*, type the function formula to be drawn: $f(x)=cosec(x^0)$ and $g(x)=a* cosec(x^0)$.

Next, a graph of the function $g(x)$ will appear:

7. Test by Moving the Slider
Shift *sliders* left/right, pay attention to the changes that occur.

8. Enable Animation and Trace
Animate *sliders*. Right-click on *sliders* so that the Context-menu appears, select it *Animation On*. Right click on the function $g(x)$, select it *Trace On*.

Pay attention to the changes that occur in the graph. It looks like the following picture.

9. Tidy up the appearance and final results
Next, tidy up the display of graphics, sliders, and so on. Below is an example of an animated graph of the cosecant function. Click the icon **play** at the bottom left or move the slider.
This concludes the guide to creating an animated graph of the cosecant function in GeoGebra. If you have suggestions or corrections, please leave them in the comments. I hope this tutorial is helpful.