Clock Animation

Creating Analog Clock Animations with GeoGebra
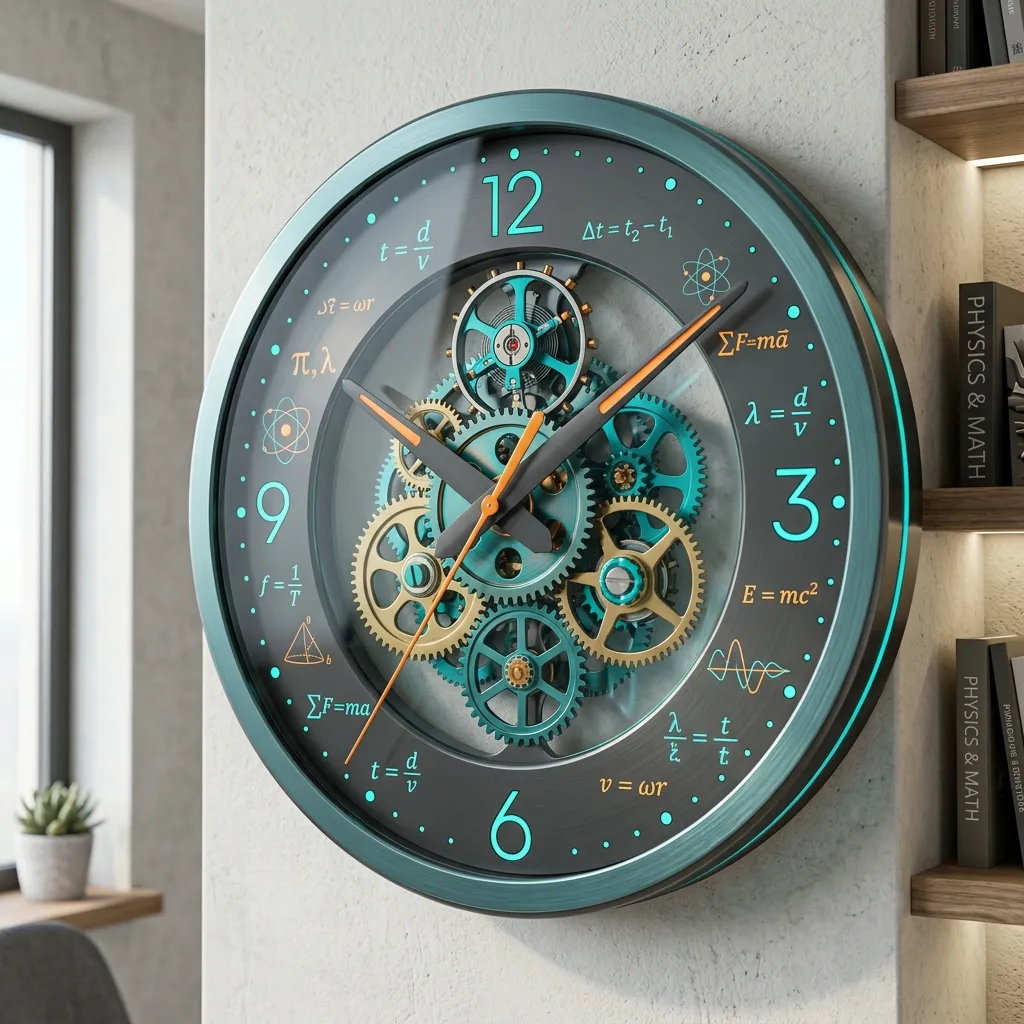
Time is the entire series covering when processes, actions, or circumstances exist or take place. Units of time are denoted by hours, minutes, and seconds. With a clock we can measure when an event occurs. Most clocks in circulation today are either analog or digital. Analog clocks have three hands. The longest hand shows seconds, the short hand shows hours, and the remaining hand shows minutes. Look at the following image.
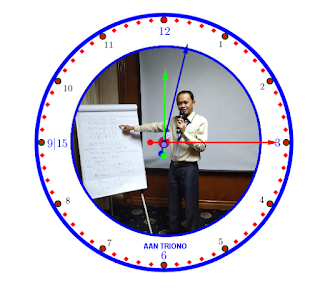
In this post, I will share a guide on how to draw and animate an analog clock using GeoGebra. With this animation, the hands of the drawn clock will move just like a real clock. How? Follow the guide below.
Steps to Create a Clock Animation
Open GeoGebra.
Select the Circle with Centre Through Point tool. Click Circle : centre & radius. In the Graphics View, create circles with radii 5, 4.8, 4, 3, and 0. Look at the following image.
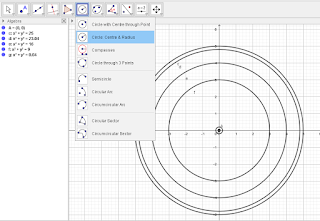
Circles in GeoGebra Next, click the Slider tool. Click on angle, fill in α, Min=0, Max=84600, increment=1. Click OK. Look at the following image.

Slider in GeoGebra Click the Point tool. In the graphics view, click on the position of the second circle, just below the number 5, and at the center of the circle. Look at the following image.

Point in GeoGebra Click the Line tool. In the graphics view, click on points A and B. Look at the following image.
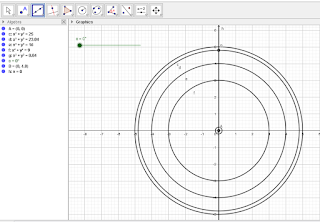
Line in GeoGebra In the Input bar, type:
Sequence(Rotate(B, α⁰, A), α, 0, 360, 30). Press Enter. Look at the following image.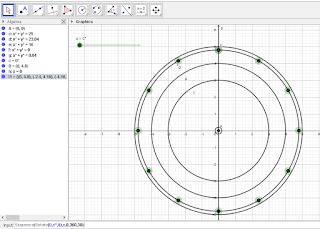
Circles in GeoGebra Still in the Input bar, type:
Rotate(h, -6α, A). Press Enter. Look at the following image.
Circles in GeoGebra Next we will create the long hand that shows seconds. Select the Line tool, click vector. In the graphics view, click the line (from step 5) near the center of the circle and drag the line past the 3rd circle. Look at the following image.
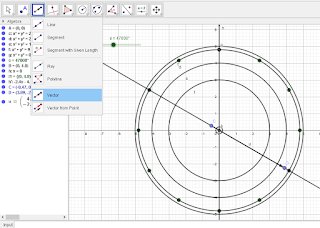
Vector in GeoGebra Right-click the newly formed line. Select and click Object Properties. Choose the desired color. Look at the following image.

Color in GeoGebra In the Input bar, type:
Rotate(h, -α/10, A). Press Enter. Look at the following image.
Vector in GeoGebra Next we will create the long hand that shows minutes. Select the Line tool, click vector. In the graphics view, click the line (from step 10) near the center of the circle and drag it past the 2nd circle. Look at the following image.
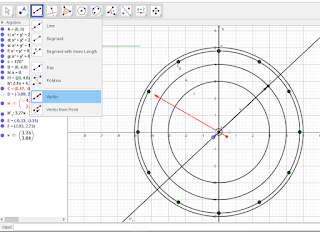
Vector in GeoGebra In the Input bar, type:
Rotate(h, -α/120, A). Press Enter. Look at the following image.
Line in GeoGebra Next we will make the short hand that shows hours. Select the Line tool, click vector. In the graphics view, click the line (from step 12) near the center of the circle and drag it toward the 2nd circle. Look at the following image.

Vector in GeoGebra In the Input bar, type:
Sequence(Rotate(B, α⁰, A), α, 0, 360, 6). Press Enter. Look at the following image.
Clock in GeoGebra Select the slider tool, click Button. In Caption, type START and in the GeoGebra Script box type
StartAnimation(α). Create a STOP button withStartAnimation(false)in the GeoGebra Script box. Finally, create a RESET button withStartAnimation(α=0).Next, tidy up the clock you have finished drawing. To make the look more appealing, apply colors to the second hand, minute hand, hour hand, the dots, and other elements. Hide the 2nd and 3rd circles. Create the numbers 1–12 and place them in their proper positions. You may also add images to make the clock more attractive.
Below is an example result of the guide to creating a clock animation in GeoGebra. Click START to begin, click STOP to pause, and click RESET to return the clock to its initial position.
Example Result
This guide shows how to draw and animate an analog clock in GeoGebra. If you notice anything that should be corrected, or if you have suggestions or questions, please share them in the comments. I hope this tutorial is helpful.